For researchers and scientists, an academic impact analytics report provides a persuasive way to show how talented and impactful you are in your fields. On Impactio, these invaluable reports are free and easily accessible! Impactio academic impact analytics tools analyze and measure a researcher’s impact in the worldwide academic community according to publications and citations.
With the leading analytics tools, you can review the worldwide academic influence of your research works. Get free and easy-to-use tools to make the most of your research work and boost your academic profile by delivering more insightful impact analytics reports.
After you sign up and provide your Google Scholar Profile Link, Impactio will automatically gather and analyze your publication and citation data. Then, you can review your academic impact analytics report on Impactio. The report demonstrates the analytics in versatile visual expressions, including bar chart graph, radar chart, and citing institution map that clearly illustrates your worldwide impact. In addition to the analytics on the website, you can export your analytics report as a PDF as well.
Now, let’s dive into the data interpretation of analytics reports that Impactio provides. First of all, Impactio breaks publication and citation analytics data down into two sections: Impact Analytics for Citations and Publications. In the Impact Analytics for Citations section, Impactio includes citations data, Citation Per Year Graphs, Academic Ranking Radial Plots, Academic Rankings, Citing Institution Maps, Citing Institution Rankings, and the Metrics and Ranks of journals where you publish articles. The Impact Analytics for Publications block provides Publication Data, Metrics, and Journal Rankings.
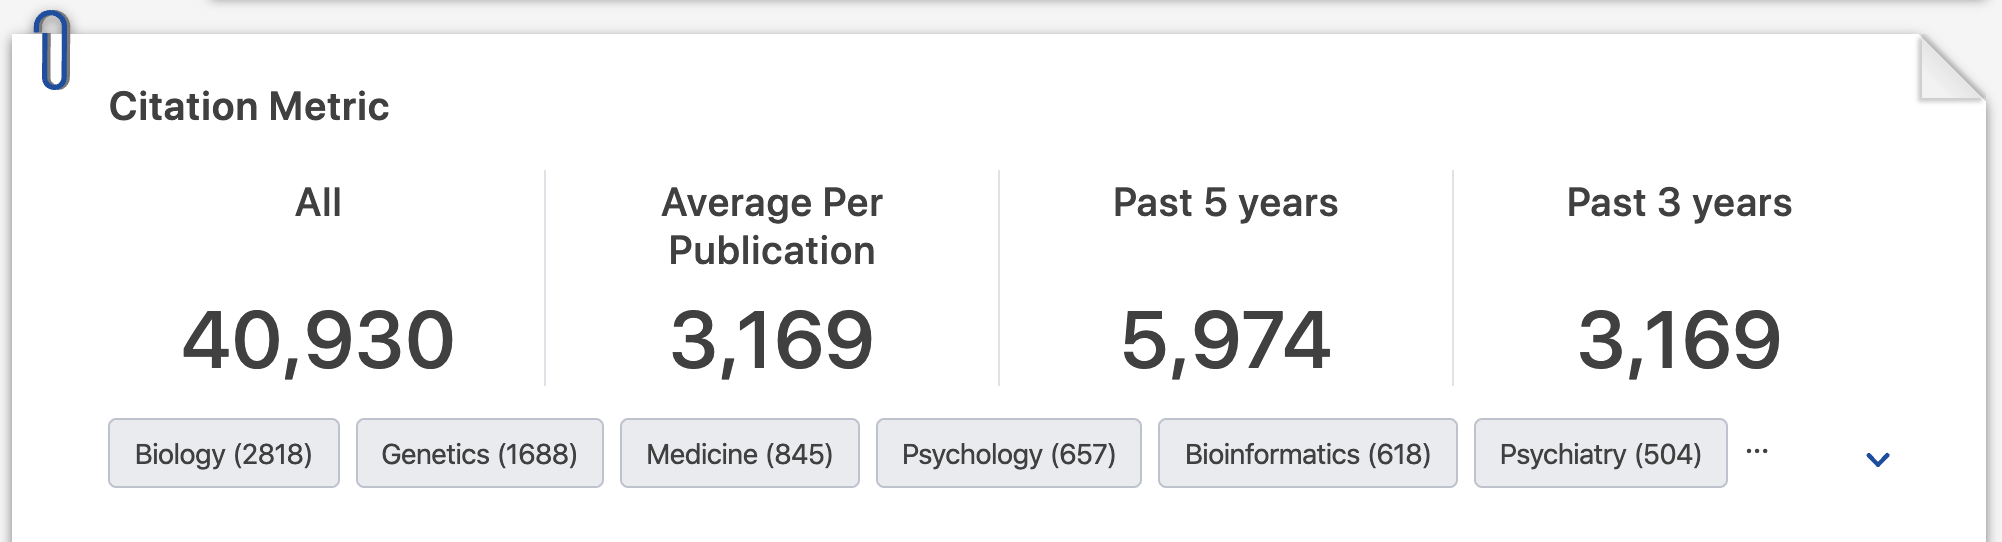
Citations
The Citation block reveals a researcher’s citation counts in total and the past 5 years or 3 years. In addition, Impactio also lists citation counts in each field of study to broadly display a researcher’s impact in specific research areas.
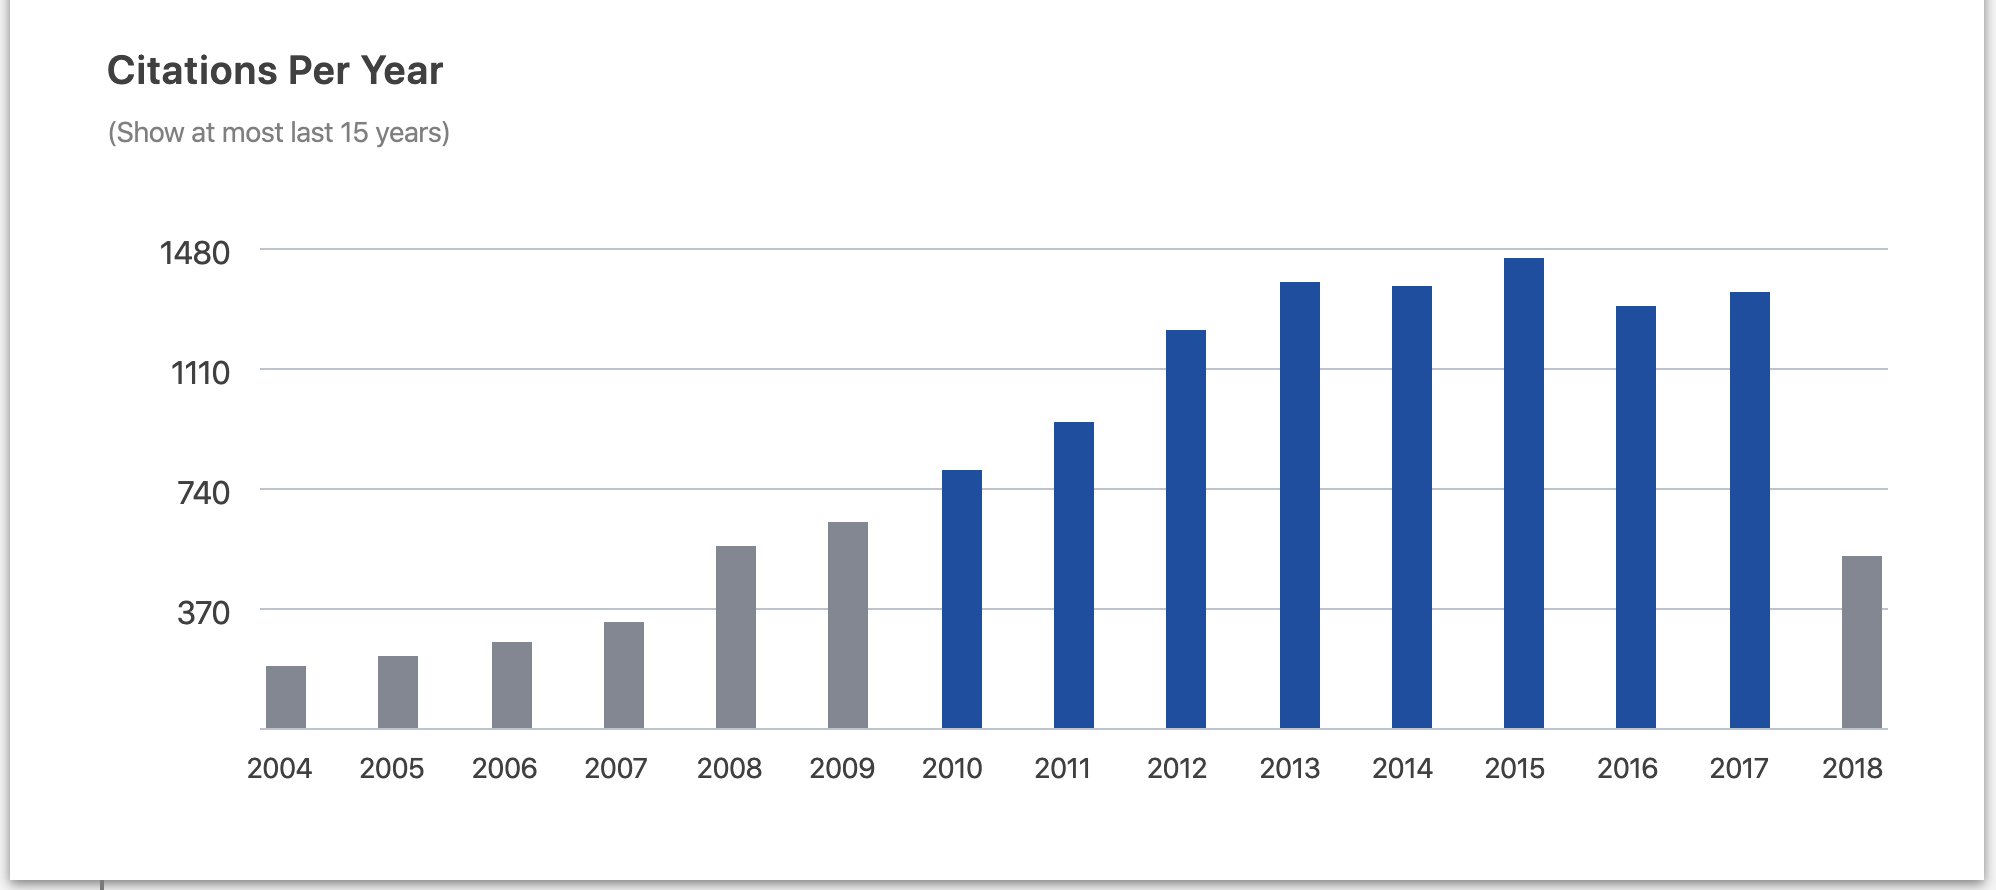
Citation Per Year Graph
The Citation Per Year bar chart effectively illustrates a researcher’s citations by year to clearly show a research’s research activity over the past 15 years.
Academic Ranking Radial Plot
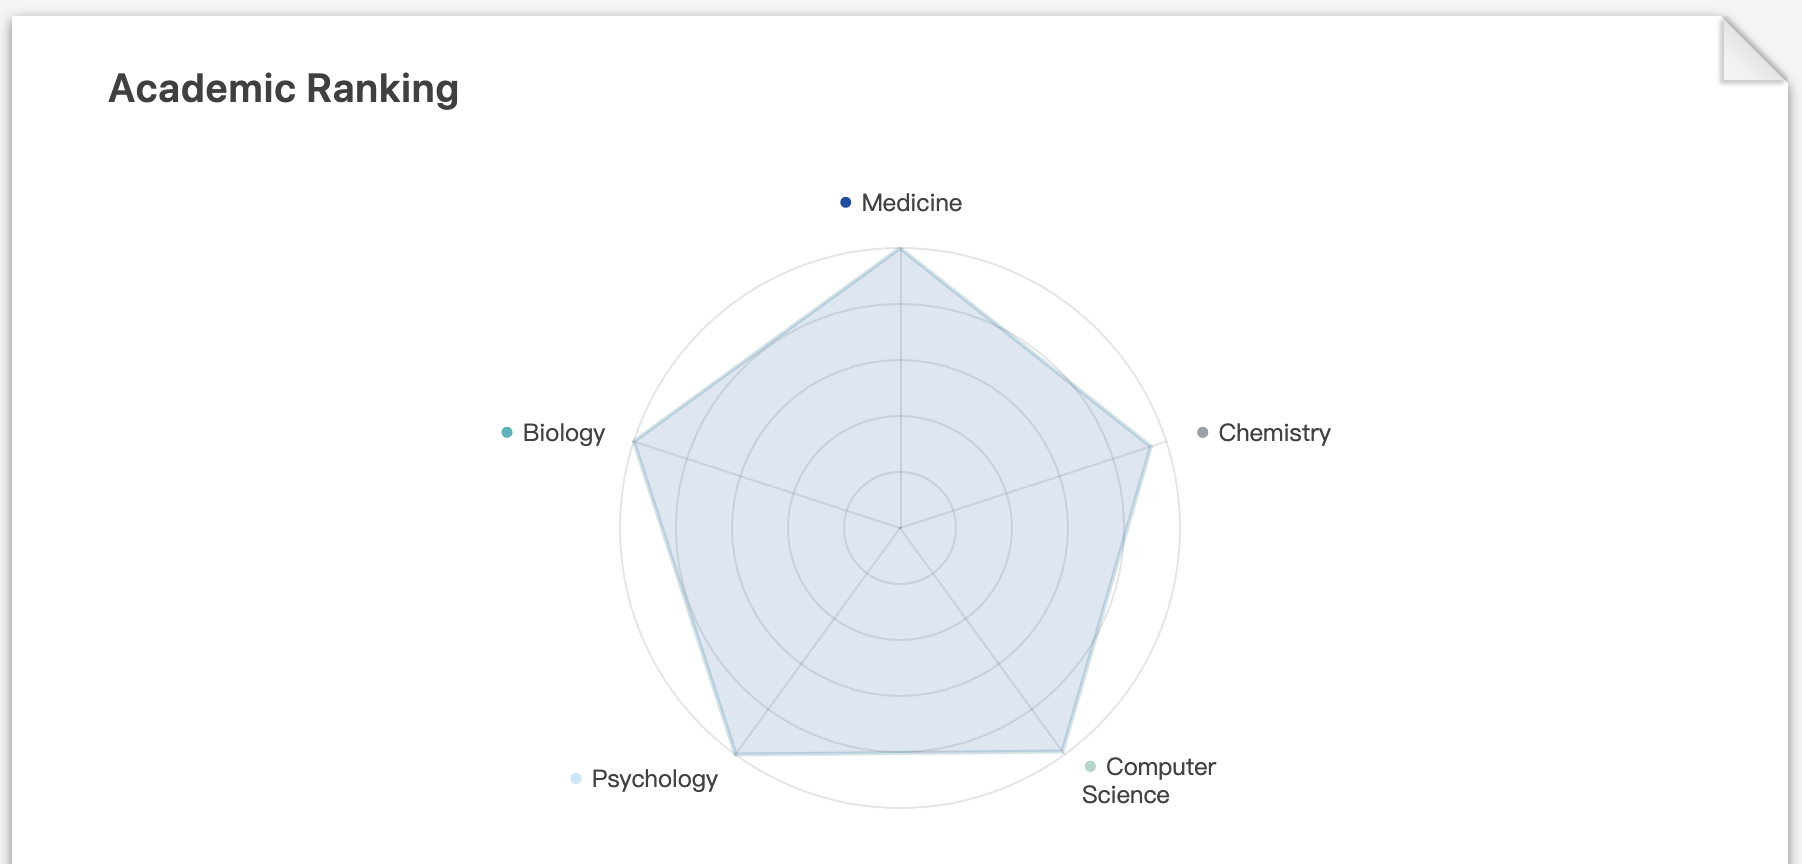
The Academic Ranking Radial Plot discloses which scientific fields a researcher excels in. Impactio offers 19 areas of study that cited your publications by default. Researchers are allowed to choose up to 5 fields from the top 19 areas provided by Impactio to exhibit preferred research areas.
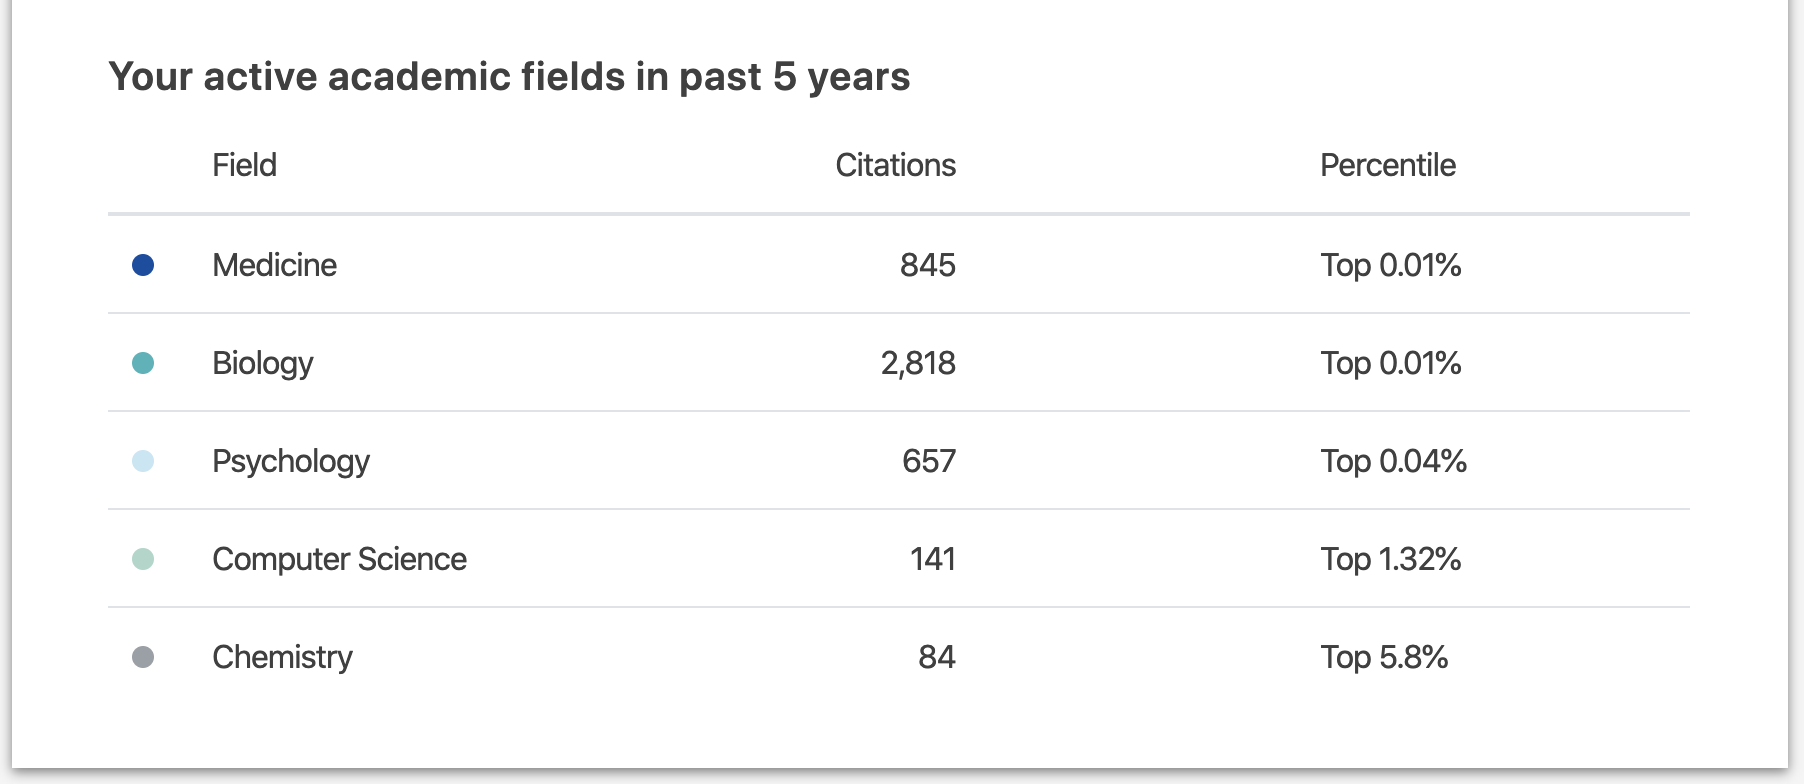
Academic Ranking
In the Academic Ranking block, researchers and scientists can acquire more detailed information about each field that cited your publications. This list includes fields of study, citation counts in a specific field and percentile which represents the ranking of a research in a field by citation counts.
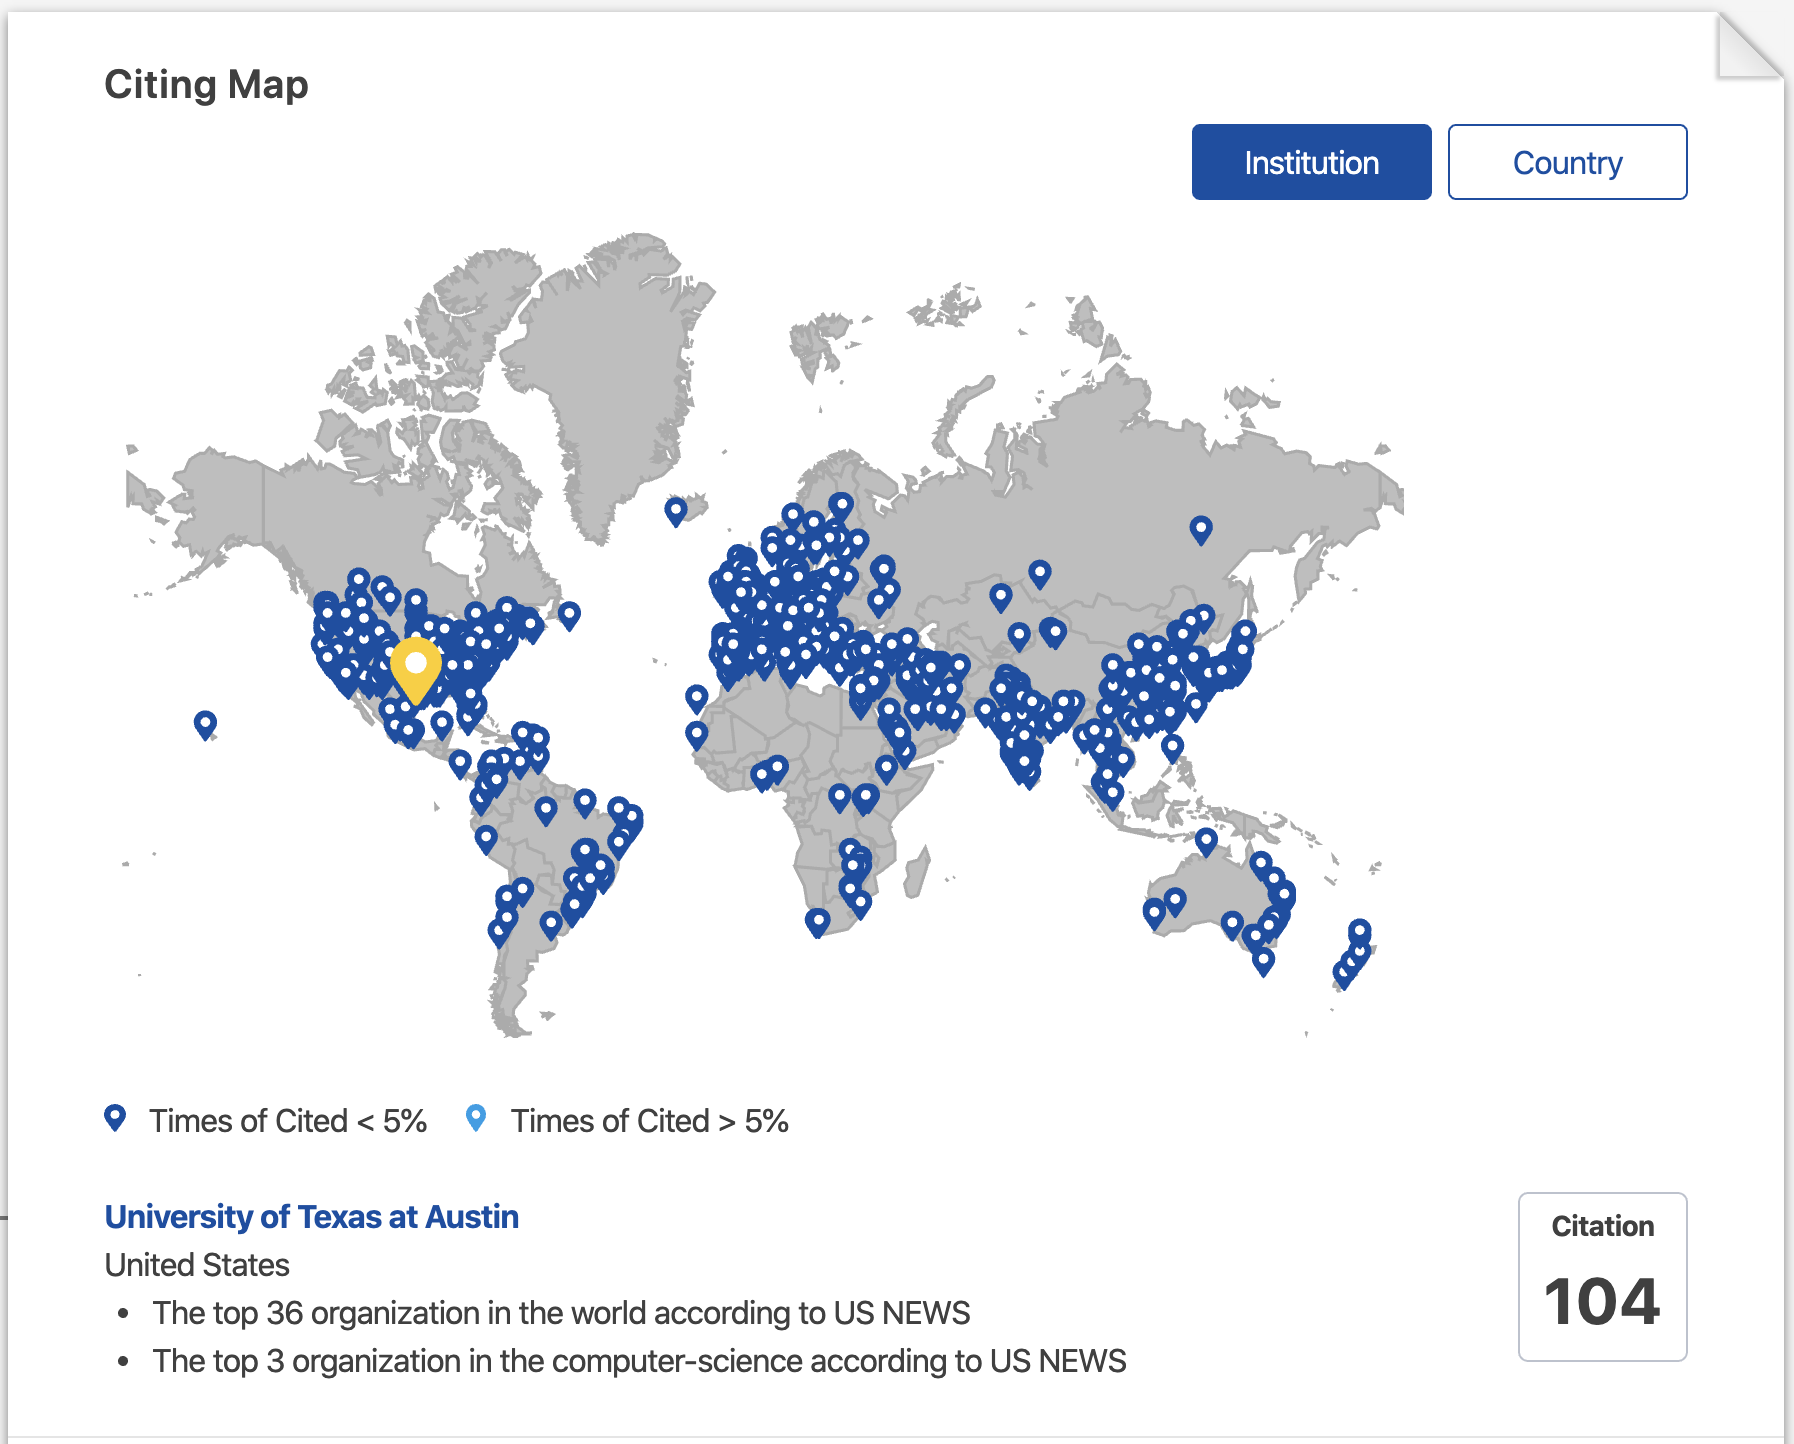
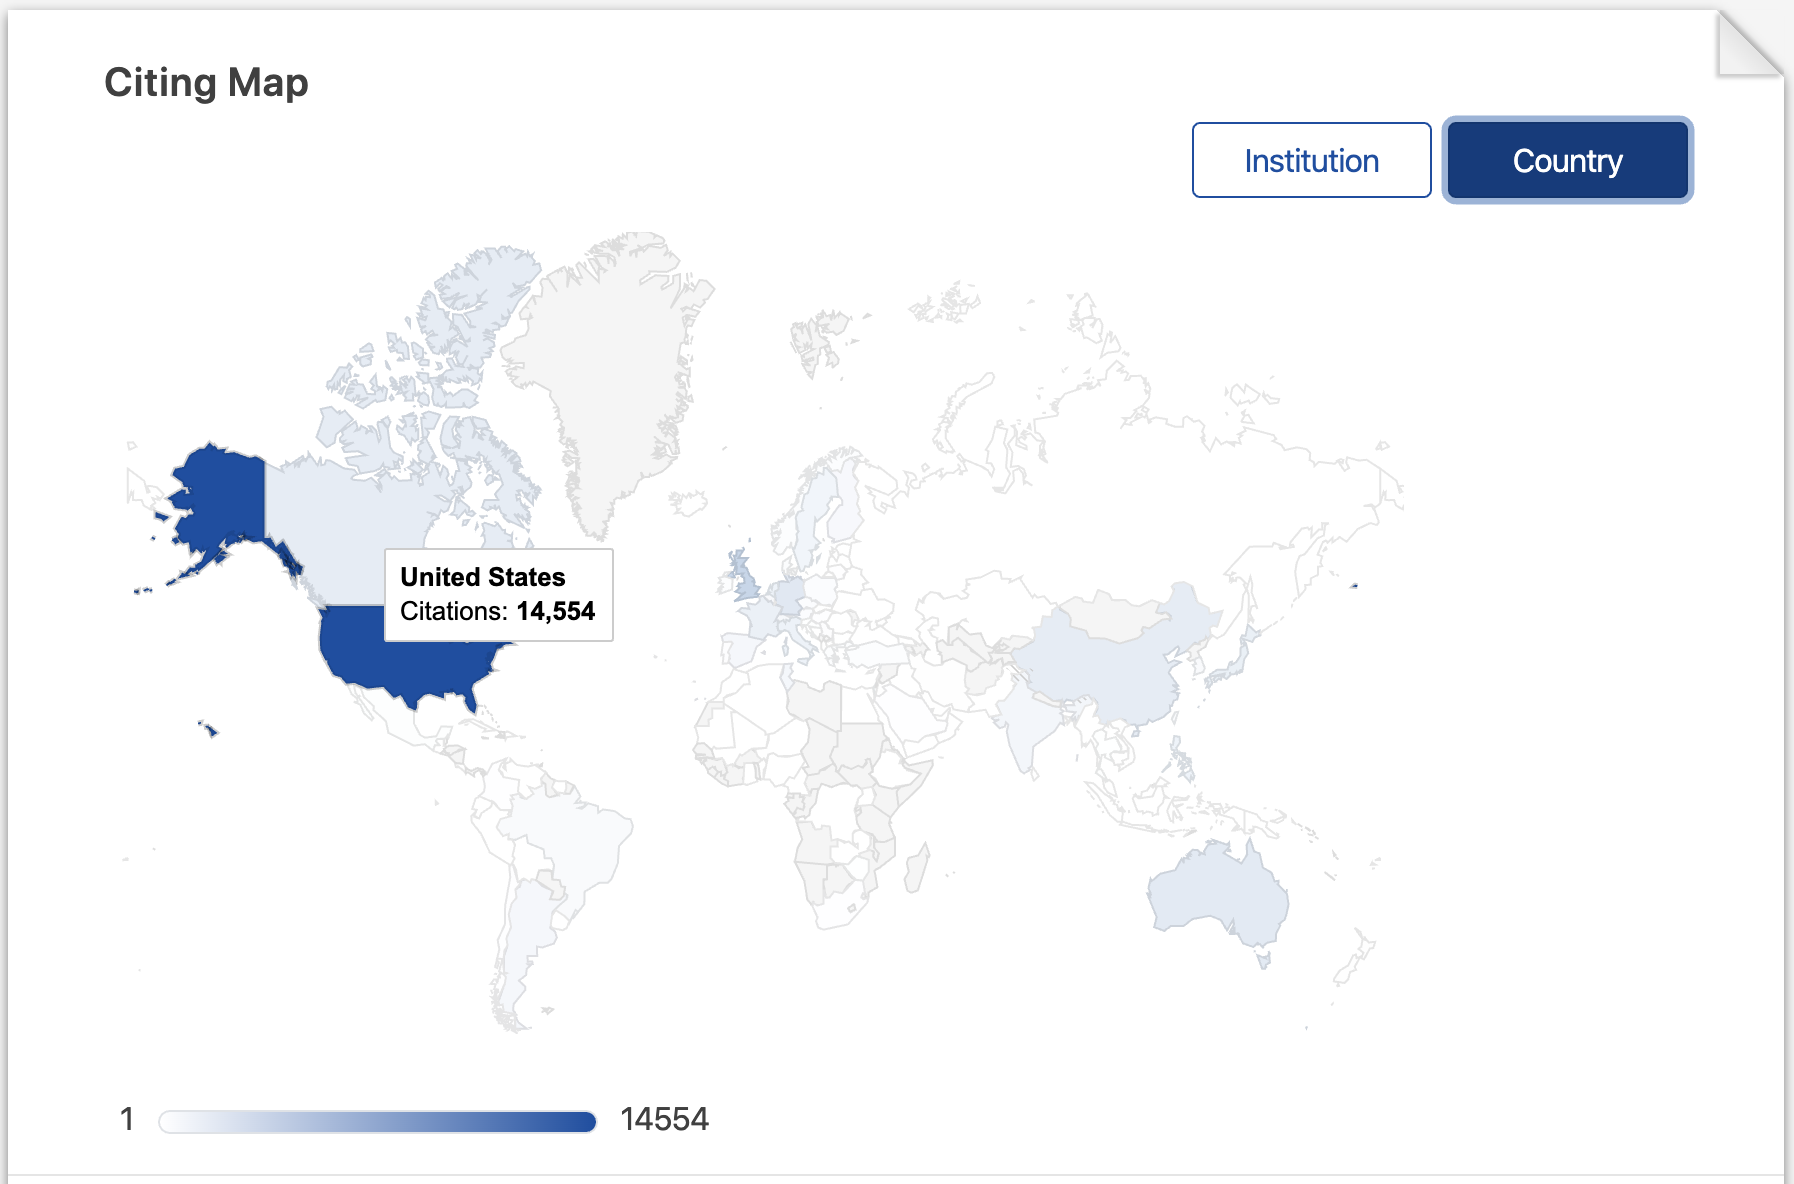
Citing Institution Map
The Citing Institution map is a powerful graphical representation that demonstrates your worldwide academic influence. The map marks the worldwide citing institution locations that cite your publications. You can also view all of the citing institutions and citations you received by country on the map. Moreover, when clicking the location icon, you can see more information about a citing institution, including the ranking of an institution and its other citations.
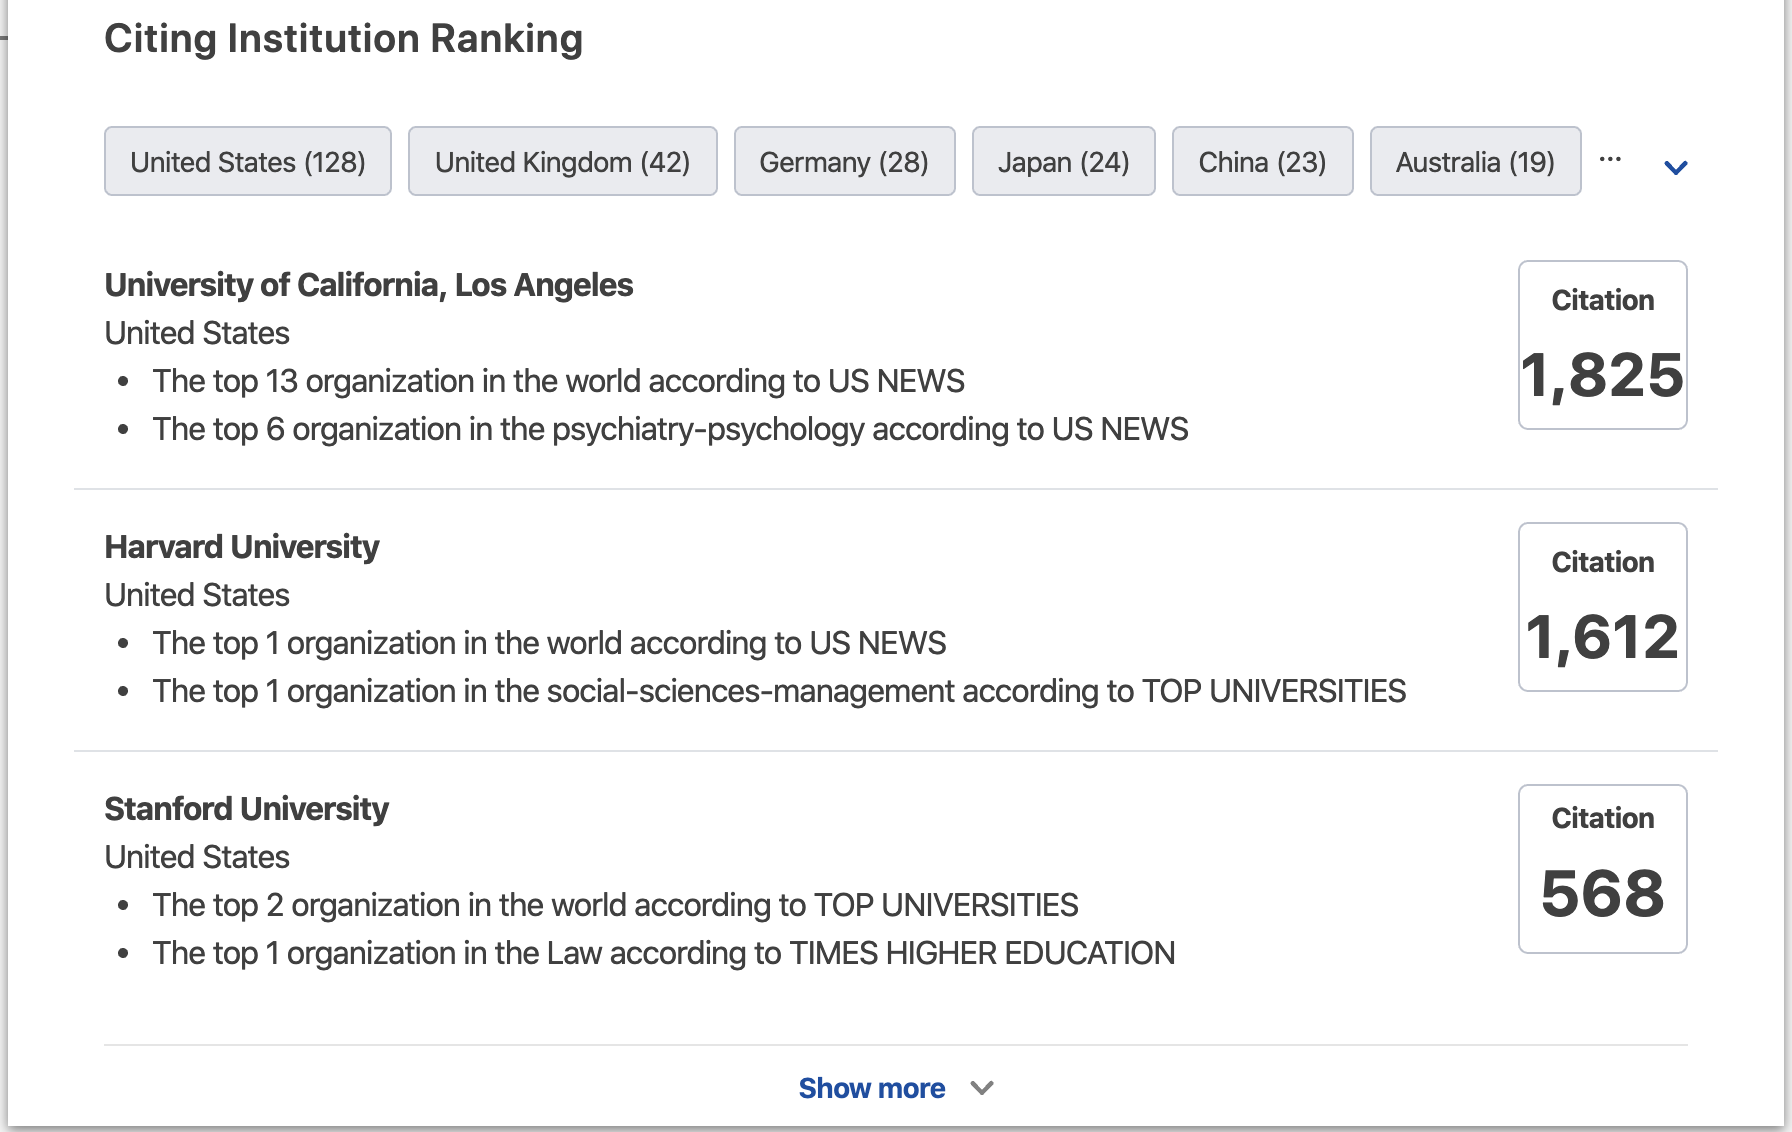
Citing Institution Ranking
In the Citing Institution Ranking block, Impactio lists total citations that a researcher received by each country. Additionally, the ranking and citation information of each citing institution are included to enable researchers to better justify a research quality and a researcher’s prestige.
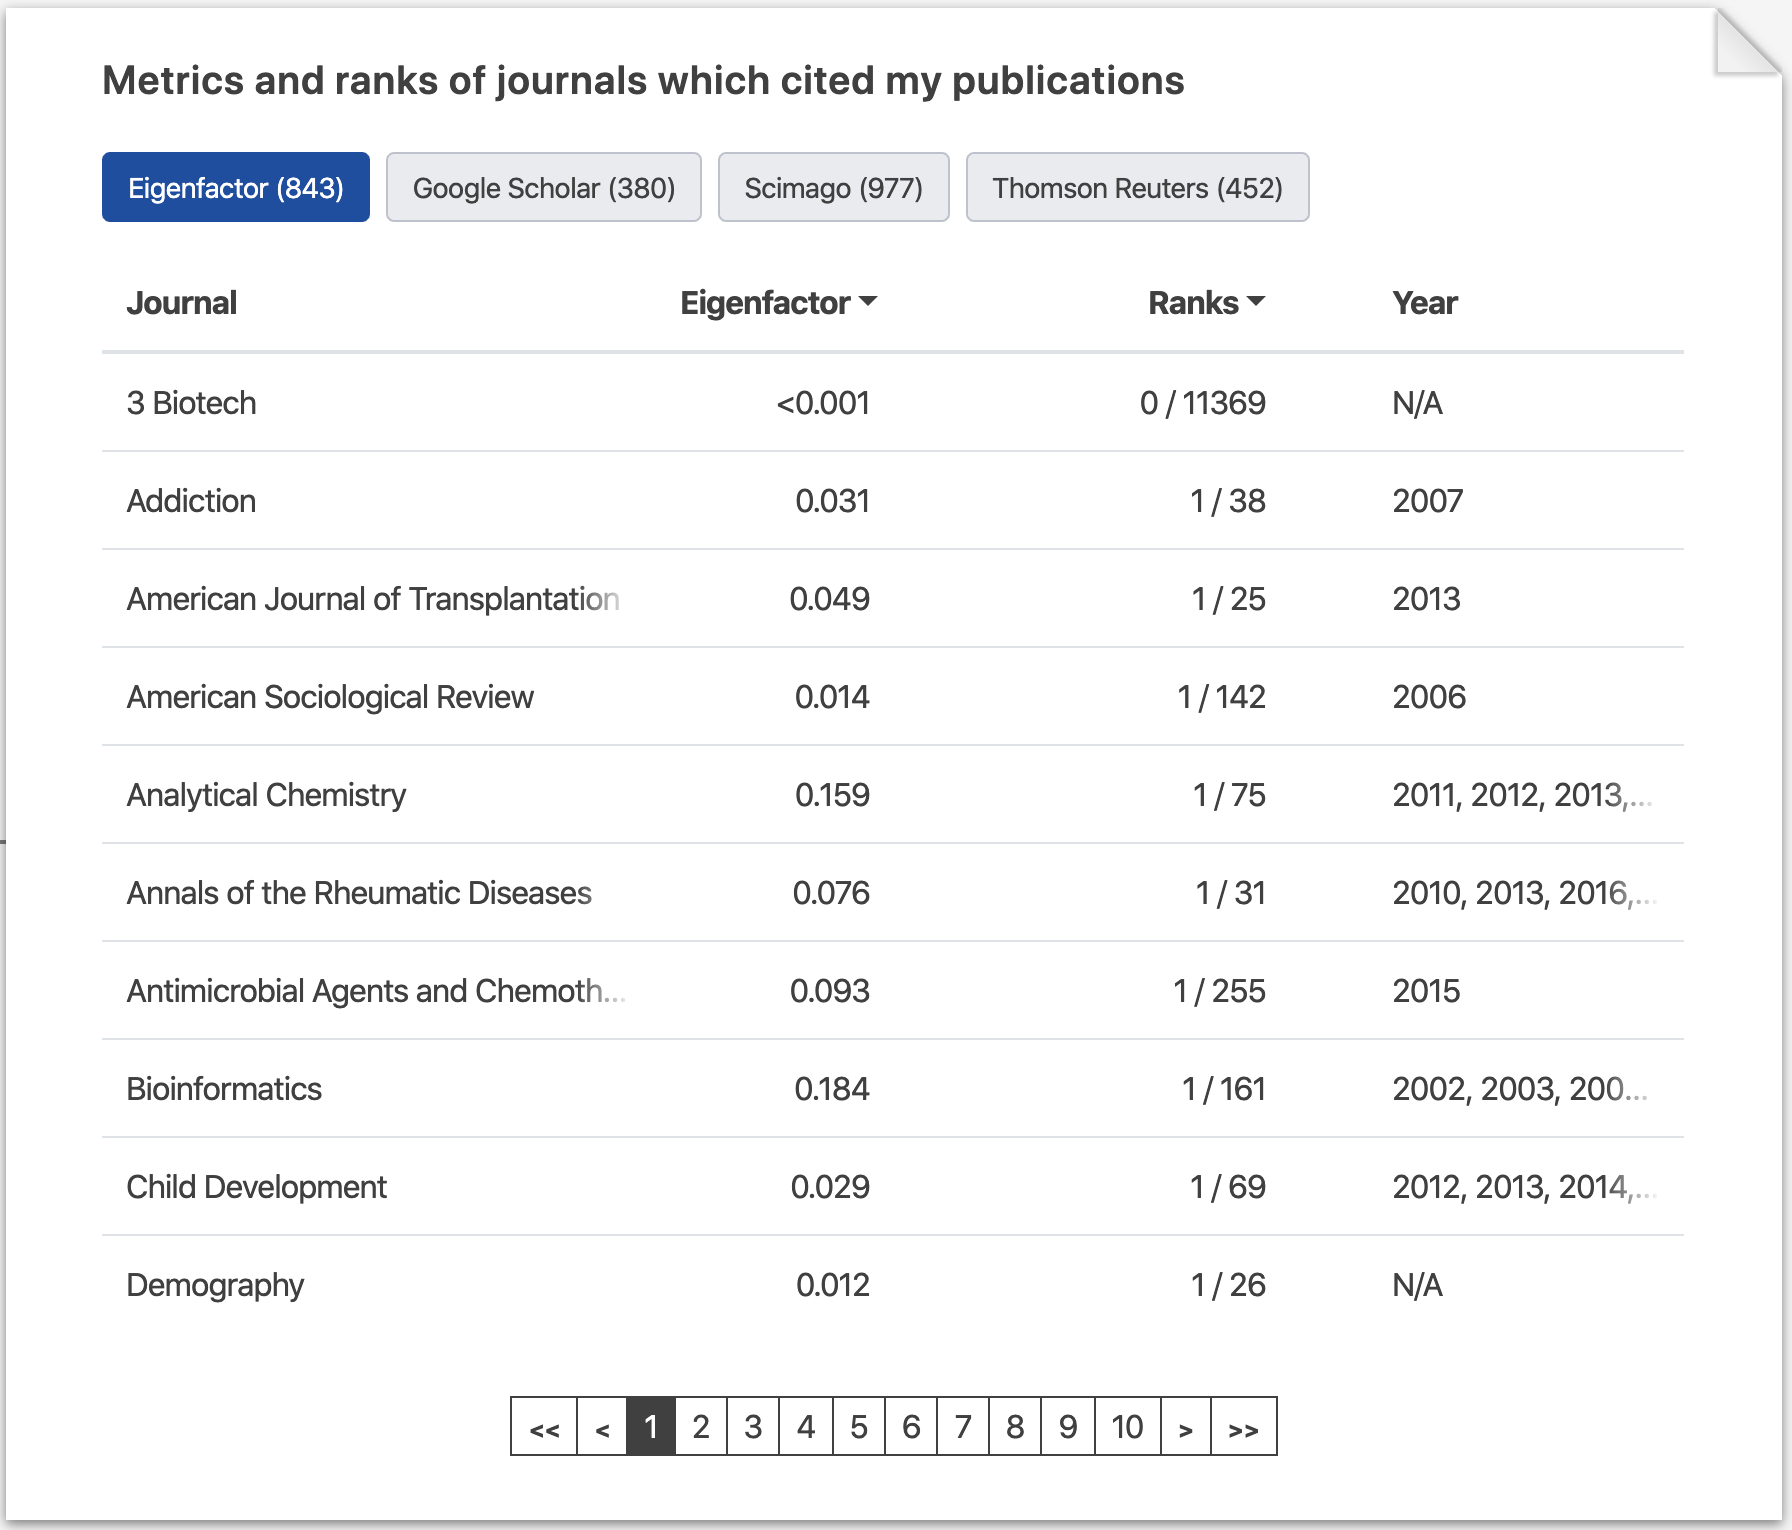
Metrics and ranks of journals which cited my publications
Have you found it difficult to review all citation-based metrics from several sources? Impactio has it all on a single platform! Impactio gathers widely used metrics, including Eigenfactor, H5-index, SJR, and Impact Factors of each journal which cited your publications.
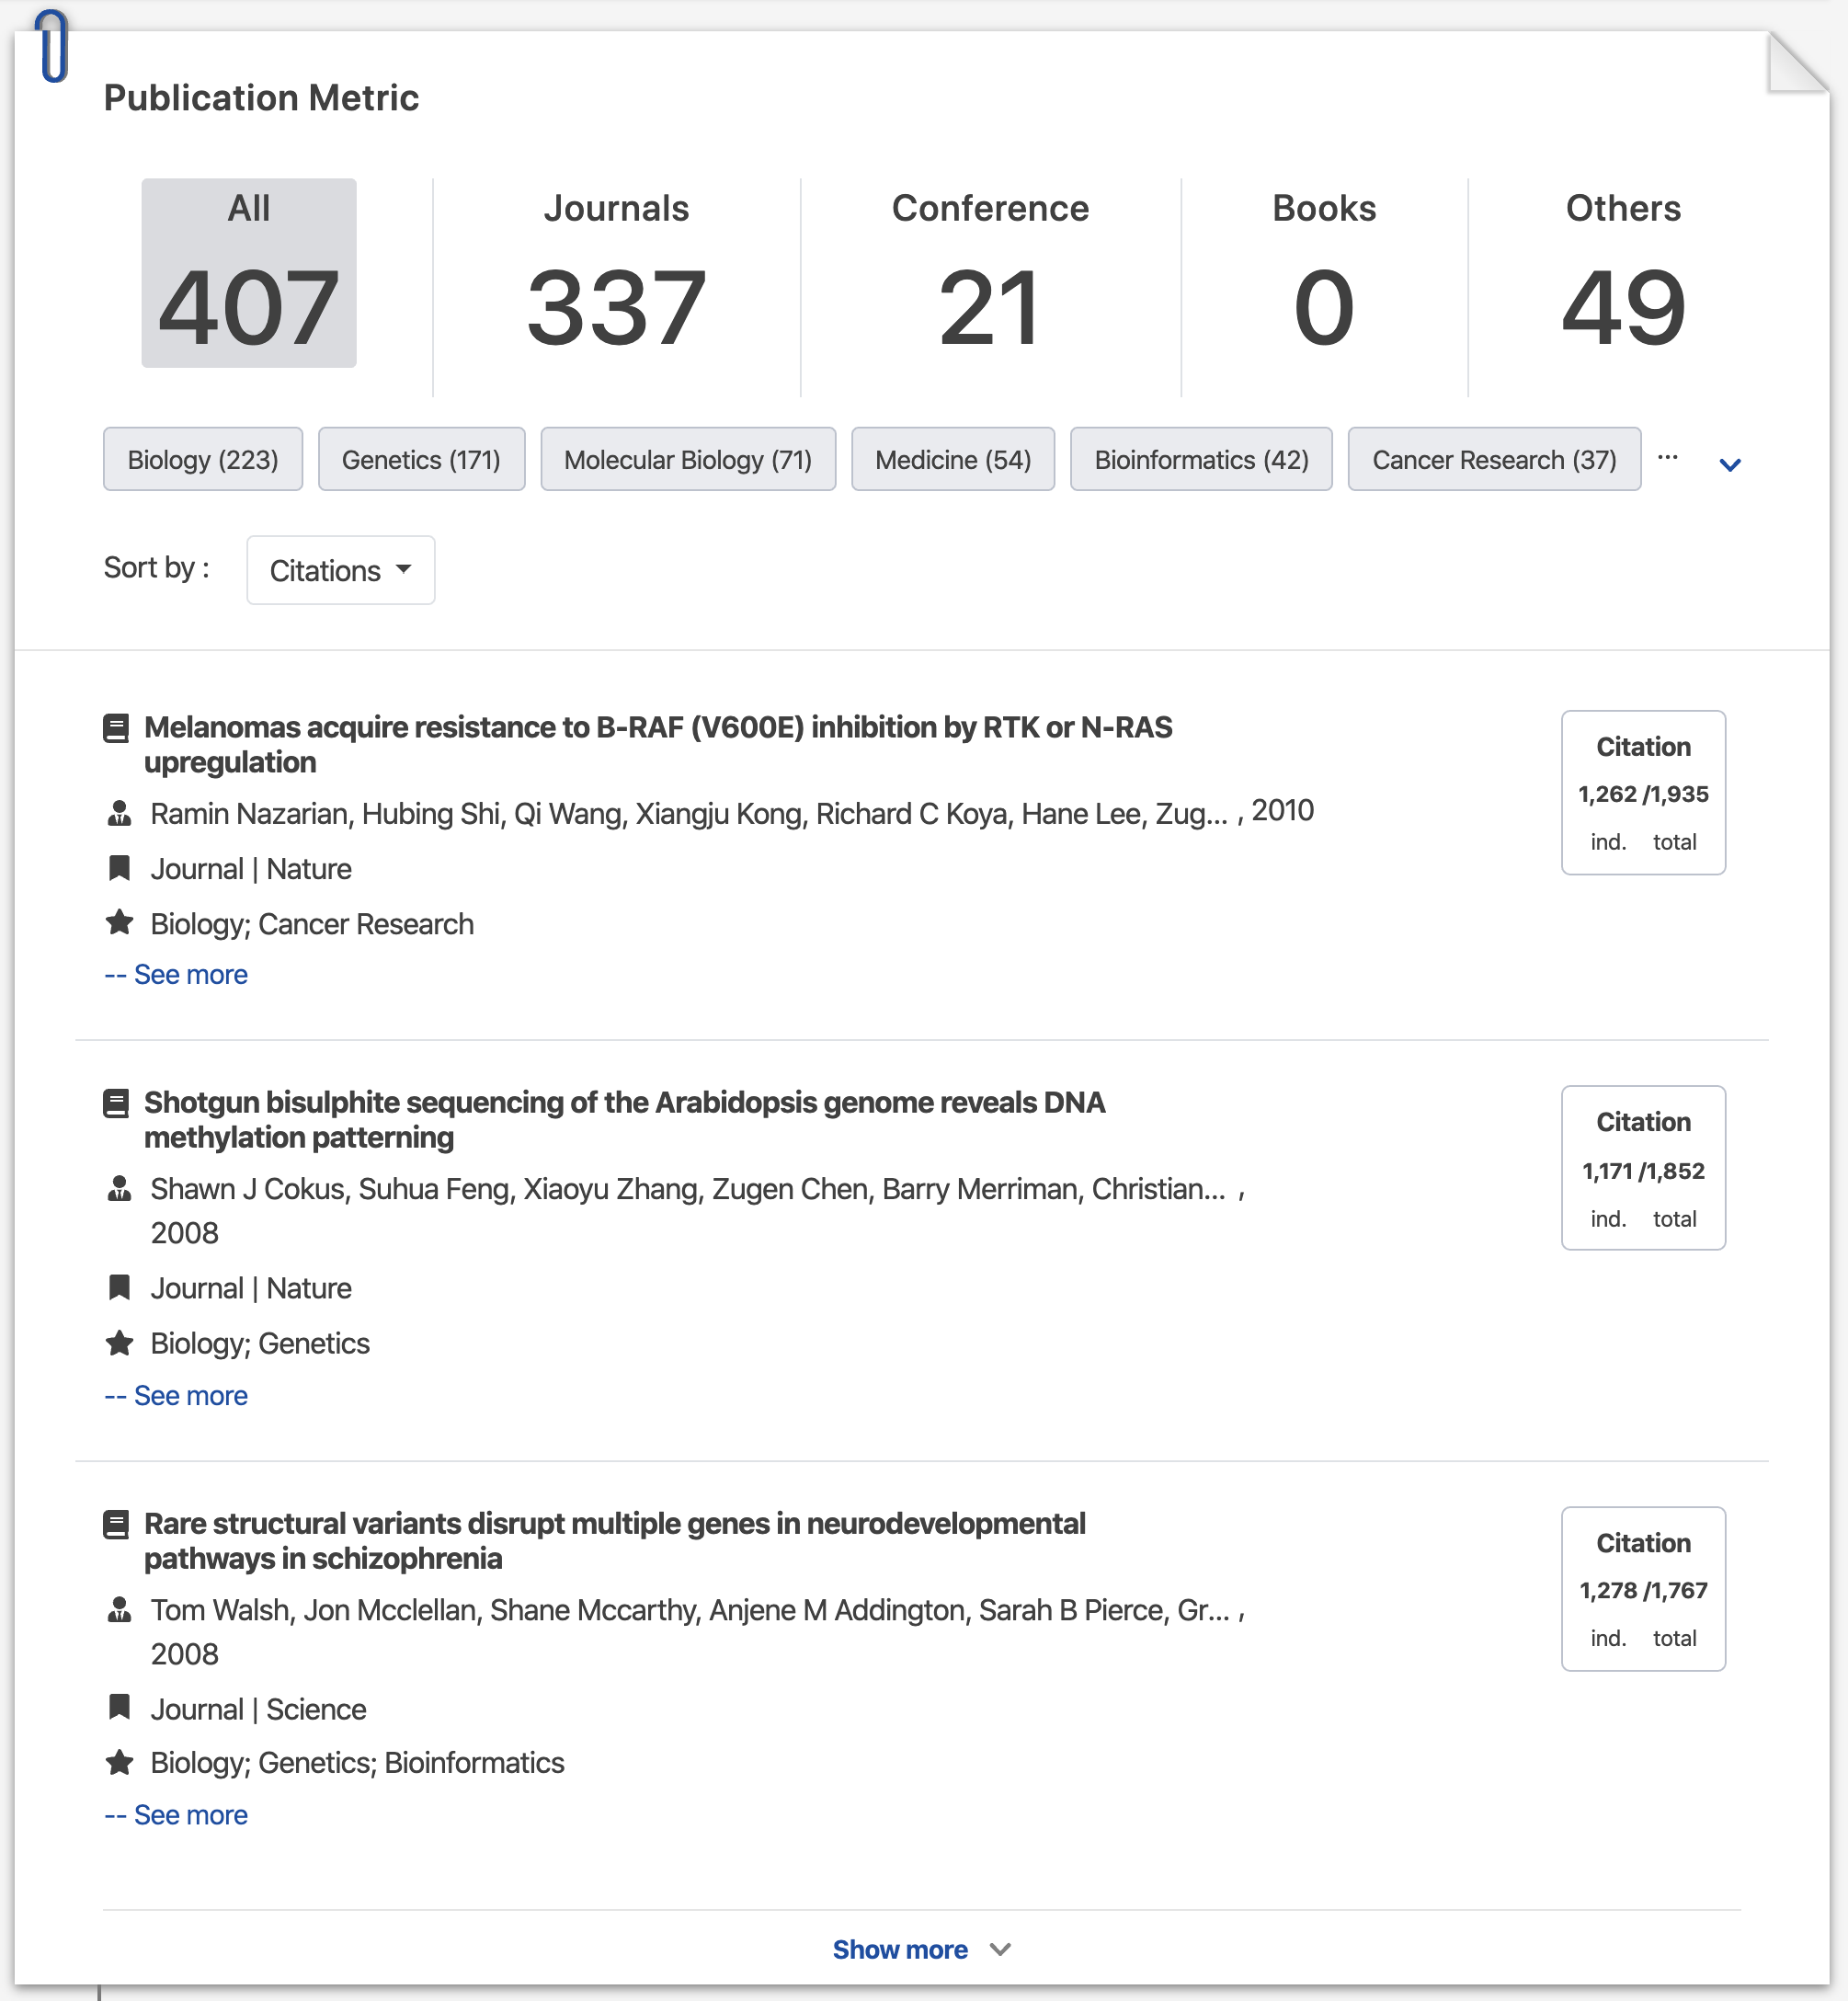
Publication
Impactio sorts all of your publications and classifies them as journals, conferences, books, and others. Likewise, Impactio lists the number of publications in each research area. Researchers can view each publication’s information, including authors, published journals, DOIs, abstracts, and Citation Per Year graphs for the publication. Most importantly, Impactio offers Independent Citation, which only counts citations outside your research group. This is valuable information to elaborate your research impact in an objective manner.
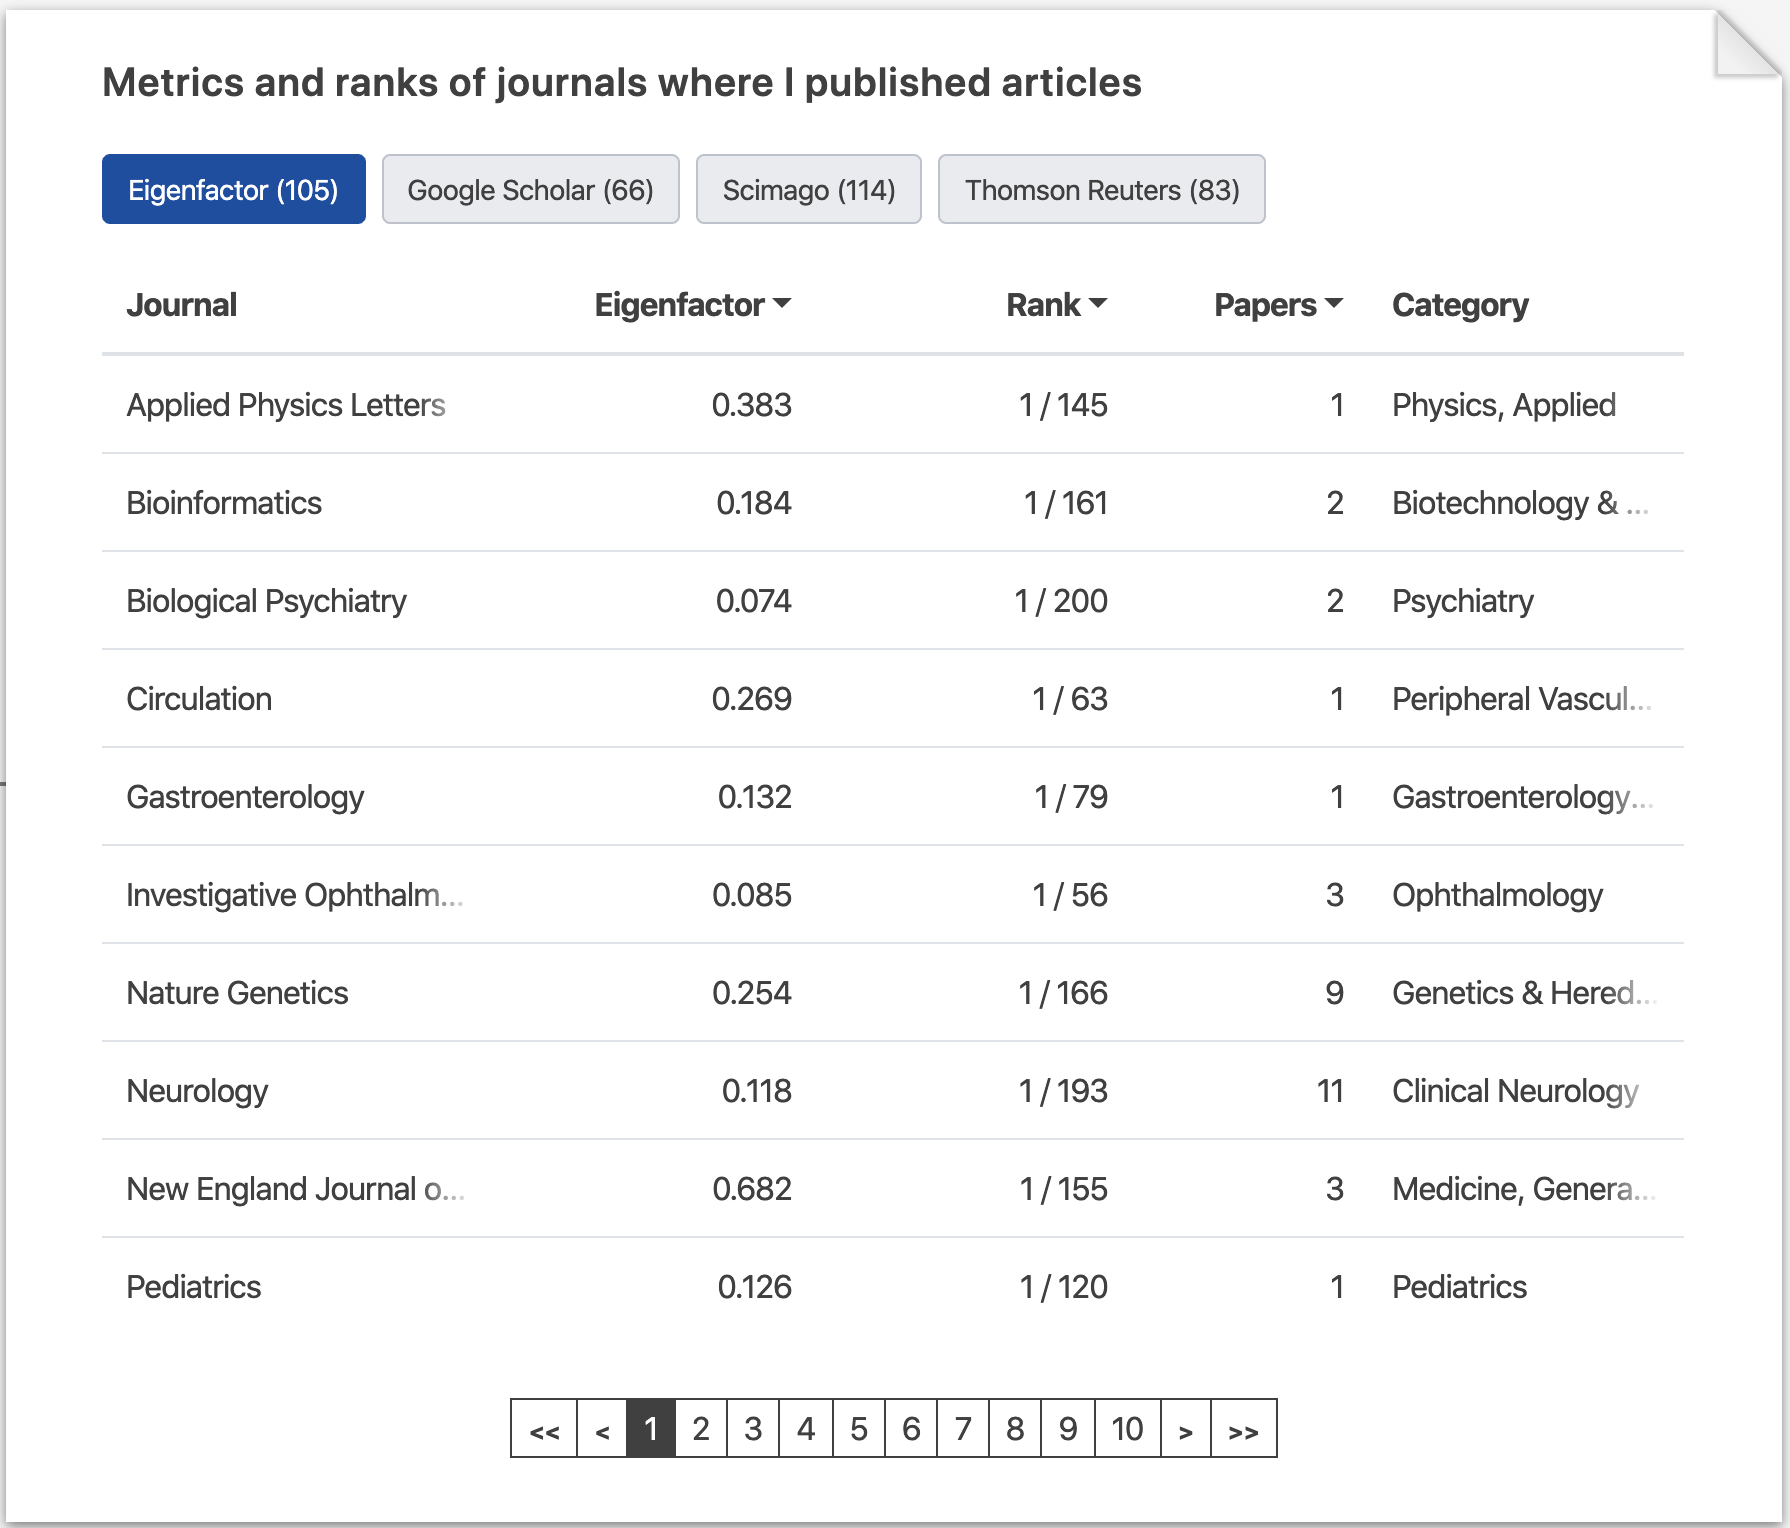
Metrics and ranks of journals where I published articles
Impactio provides quantitative information for the journals where a researcher published articles. In this section, researchers can view metrics and ranks of journals where they published articles. The table includes journal name, four metrics, ranks, and total papers in the journal or category.